
Blog/Explainer
Average Screen Time for Adults: The 2026 Numbers, by Age
How long adults really spend on phones, TV and feeds, from phone logs, national surveys and global data, and how to read your own number.

In this article
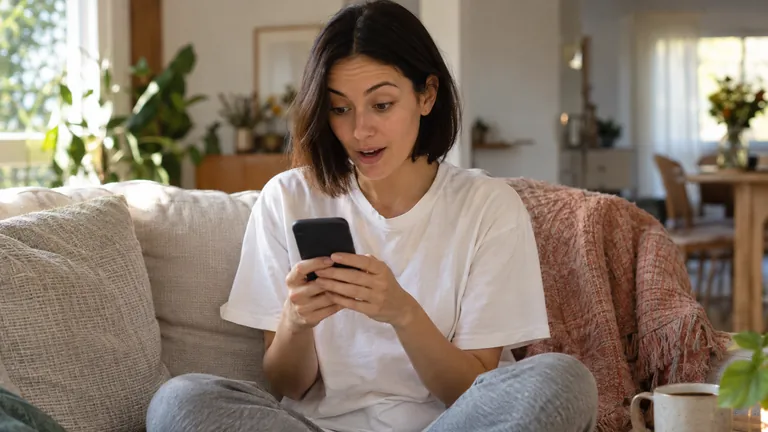
Adults use their phones for roughly 4 to 6 hours a day, when researchers read the phone's own logs instead of asking people to guess. On top of that, Americans aged 15 and over watch about 2.6 hours of television a day.
Here are the most reliable numbers available in October 2026, what changes with age, and how to compare your own.
Average screen time for adults at a glance
| What was measured | Average | Who |
|---|---|---|
| Phone use, from the phone's own logs | About 6 hours a day (median 364 minutes) | 10,099 US adults with Android phones, published 2025 [1] |
| iPhone use, from Apple's Screen Time | 3 hours 53 minutes a day, 86 pickups | 238 adult iPhone users, published 2019 [2] |
| Watching TV | 2.6 hours a day | Americans aged 15 and over, 2025 [6] |
| Games and leisure computer use | 37 minutes a day | Americans aged 15 and over, 2025 [6] |
| Social media and online video | 19 hours 18 minutes a week | The typical internet user worldwide, 2026 [10] |
These numbers overlap: a show on TV with a phone in hand counts in two rows at once. That's why nobody can honestly add them up into one total.
How much time do adults spend on their phones?
The best evidence comes from studies that record use directly, because people are poor judges of their own phone time (more on that below).
The largest recent study recorded the phones of 10,099 American adults for four weeks, about 250,000 days of data in all. The typical person spent 364 minutes a day in apps, a little over 6 hours, and the average was 391 minutes. They unlocked their phones a median of 41 times a day. Social media took a median of 43 minutes a day, but with a long tail: many people spent upward of 300 minutes a day in social apps [1]. One caution: everyone in the study used an Android phone, and they were recruited through social media posts by the University of Oregon and Google.
On iPhones, a study that collected Apple's Screen Time data from 238 adult iPhone users, average age 32, found 3 hours and 53 minutes a day, 86 pickups and 90 notifications [2]. That study was published in 2019, before several years of growth in short video.
In an earlier study that logged the phones of 23 young adults for two weeks, the average was 5 hours a day and 85 uses [3].
Put together, 4 to 6 hours a day is a fair range for an adult's phone, with roughly 40 to 85 pickups.
You probably can't guess your own number
Asking people how much they use their phones turns out to be a poor way to find out:
- In the two-week study above, people guessed they used their phones about 37 times a day. They actually used them 85 times [3].
- Among 325 iPhone users, guesses about weekly iPhone use were off by 19.1 hours on average, and guesses about social media by 12.2 hours [4].
- A meta-analysis of studies that compared the two found that self-reports agree only moderately with logged use and are rarely accurate [5].
That matters for two reasons. Many headline statistics you'll see are based on what people say, not what their phones record. And your own sense of your screen time is probably off too, in one direction or the other.
Average screen time by age
Younger adults live on their phones; older adults watch more television. Here's how the numbers break down.
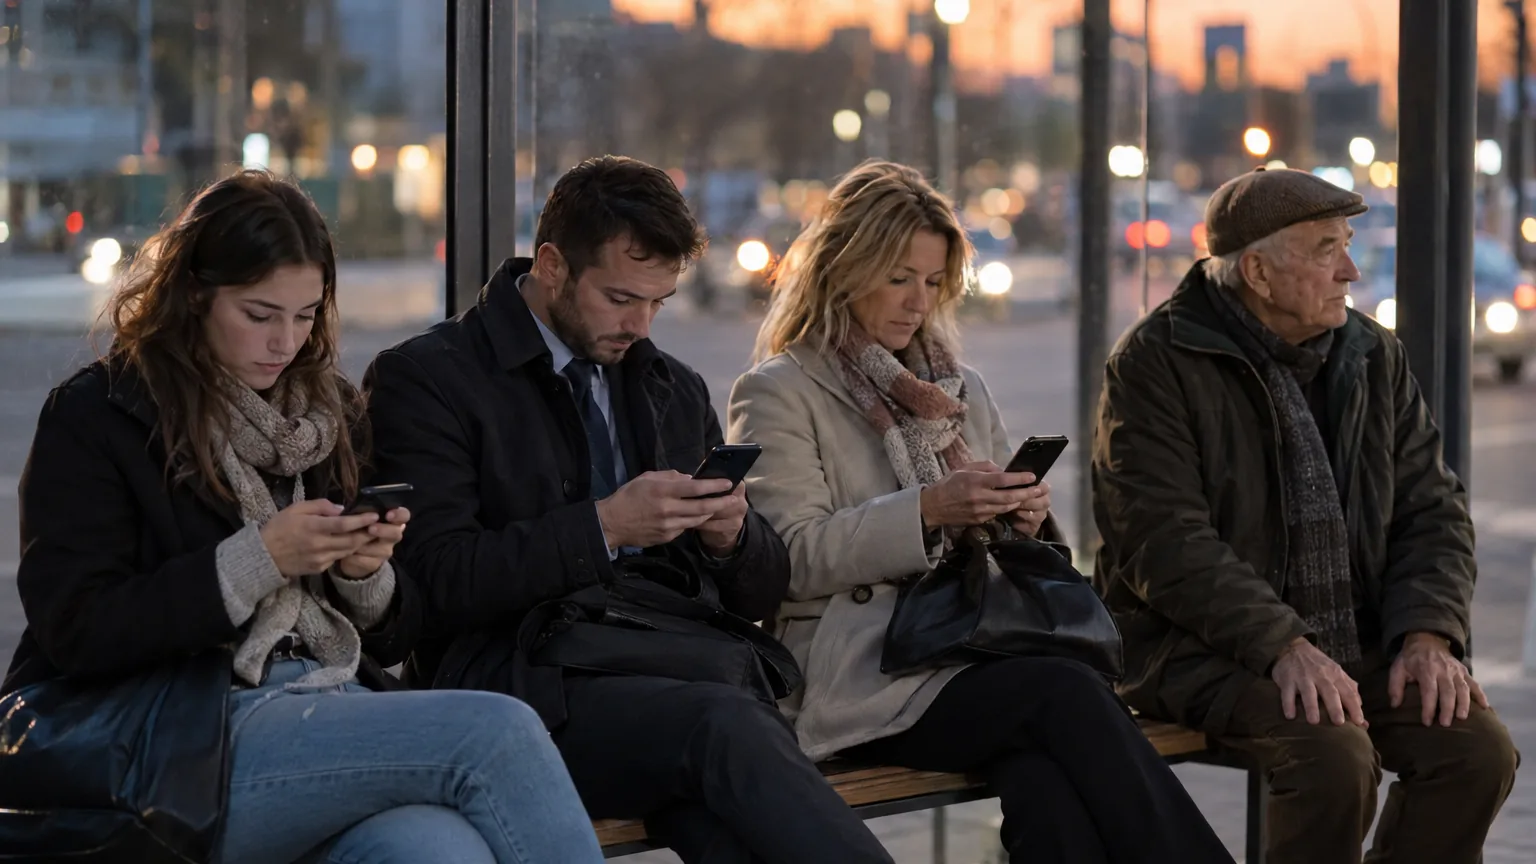
Phones. In a US survey from May and June 2026, 42% of adults under 30 said they're on their smartphone almost constantly, as did a third of those aged 30 to 49, 21% of those aged 50 to 64 and 9% of those 65 and older [8]. Seven in ten adults under 30 said they spend too much time on their phone, as did about two-thirds of those aged 30 to 49, roughly half of those 50 to 64 and a quarter of those 65 and older. Adults under 30 were also the only age group in which a majority, 62%, said their phone hurts their sleep [8].
Being online. In Pew's 2025 survey, 63% of adults aged 18 to 29 said they're online almost constantly, compared with 14% of those 65 and older [9].
Feeds. Worldwide, internet users aged 16 to 24 spend well over 24 hours a week scrolling social and video feeds, more than three times as much as internet users aged 65 and above [10].
Television. Here the pattern flips. In the American Time Use Survey for 2025, daily TV time by age was [7]:
| Age | Watching TV, hours a day | Games and leisure computer use, hours a day |
|---|---|---|
| 20 to 24 | 2.07 | 1.08 |
| 25 to 34 | 1.89 | 0.91 |
| 35 to 44 | 1.76 | 0.44 |
| 45 to 54 | 2.26 | 0.39 |
| 55 to 64 | 3.06 | 0.26 |
| 65 to 74 | 4.20 | 0.43 |
| 75 and over | 4.43 | 0.48 |

So screen time doesn't simply fall with age. The screen changes.
An average tells you what's common. It doesn't tell you what's good for you.
TV still counts
Television is still the biggest single block of free time in the US. In 2025, Americans aged 15 and over spent 2.6 hours a day watching TV, half of all their leisure time, which averaged 5.2 hours. Time spent playing games or using a computer for leisure rose to 37 minutes a day, from 25 minutes in 2015 [6].
Worldwide, online video has now overtaken television. Internet users aged 16 and above report 12 hours and 5 minutes of online video a week, against 9 hours and 58 minutes for scheduled, on-demand and streaming TV combined [10].
Screen time around the world
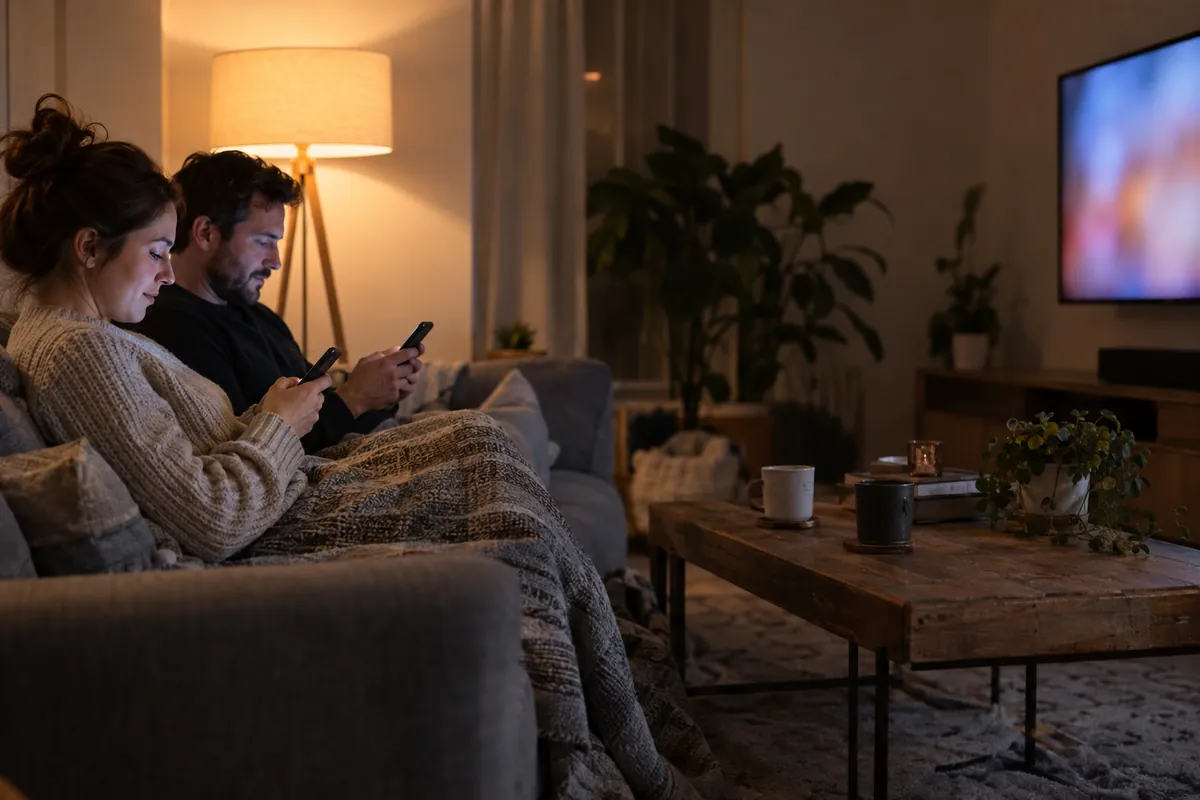
The latest global figures come from DataReportal's October 2026 report, which draws on GWI's surveys and Similarweb's app data [10]:
- The typical internet user now spends 19 hours and 18 minutes a week on social media and online video platforms, about 2 hours and 45 minutes a day, and 42 minutes a week more than a year earlier.
- In the Philippines, the typical person spends more than 36 hours a week on social and video feeds, and social media time passes 24 hours a week in 12 countries.
- Among each app's active users, the average time spent in its mobile app in August 2026 was 1 hour 55 minutes a day for TikTok, 1 hour 40 minutes for Instagram, 1 hour 28 minutes for YouTube and just under an hour for Facebook.
GWI recently changed the survey questions it uses for time spent with media, so these figures can't be compared exactly with older reports [10].
How does your screen time compare?
- Get your real number. Open Settings, then Screen Time, and look at the whole week rather than one day: your daily average, how often you pick up your iPhone, how many notifications you get and the apps at the top.
- Compare it with the right average. Measured phone use runs about 4 to 6 hours a day for adults. Survey numbers based on guesses can be far off in either direction.
- Split what you'd keep from what you'd take back. Work, maps and calls with people you love aren't the problem. The hours in feeds you didn't plan to open are.
- Decide what too much means for you. There's no official limit for adults, but there are clear signs. We went through the research in how much screen time is too much.
If the gap between your number and the life you want is wide, give the apps that cause it a limit. With the Less scrolling goal in Unrotten, the apps you choose lock with Apple's Screen Time shield once your daily limit is used up, until the day resets. And because an hour is easier to wave away than money, Unrotten can show the time you take back from those apps as money, at your own hourly wage, even in the Dynamic Island.
Apple's built-in tools are a good place to start, too. We compared them with screen time apps in Apple Screen Time vs a screen time app.
The number that matters more than the average
Being average means your phone takes 4 to 6 hours of your day, like most people's. That's worth knowing, but it isn't a verdict. The useful question is whether those hours go where you'd choose to put them. Check your weekly report, pick the one app that takes the most without giving much back, and start there.
Questions people ask
What is the average screen time for adults?
Studies that read people's phones directly find that adults use their phones for roughly 4 to 6 hours a day. In a 2025 study of 10,099 American adults, the median was about 6 hours of app time a day. On top of that, Americans aged 15 and over watch about 2.6 hours of TV a day.
What is the average screen time per day on an iPhone?
In a study that collected Apple's Screen Time data from 238 adult iPhone users, the average was 3 hours and 53 minutes a day, with 86 pickups and 90 notifications. That study was published in 2019; a larger and more recent study of Android users found a higher daily total.
How does screen time change with age?
Younger adults spend more time on phones and feeds: 42% of Americans under 30 say they're on their smartphone almost constantly, against 9% of those 65 and over. Older adults watch more TV: about 1.9 hours a day at ages 25 to 34, and 4.2 to 4.4 hours from 65 on.
Is my screen time normal?
Compare the daily average in your iPhone's Screen Time report with what phone logs show, roughly 4 to 6 hours a day, not with what people guess, because guesses are often far off. Then ask a better question than whether it's normal: whether those hours go where you want them to.
References
- Winbush A, McDuff D, Hernandez J, Barakat A, Jiang A, Heneghan C, et al. "Smartphone use in a large US adult population: Temporal associations between objective measures of usage and mental well-being." Proceedings of the National Academy of Sciences. 2025;122(43):e2427311122. doi:10.1073/pnas.2427311122 ↩
- Ellis DA, Davidson BI, Shaw H, Geyer K. "Do smartphone usage scales predict behavior?" International Journal of Human-Computer Studies. 2019;130:86-92. doi:10.1016/j.ijhcs.2019.05.004 ↩
- Andrews S, Ellis DA, Shaw H, Piwek L. "Beyond Self-Report: Tools to Compare Estimated and Real-World Smartphone Use." PLOS ONE. 2015;10(10):e0139004. doi:10.1371/journal.pone.0139004 ↩
- Sewall CJR, Bear TM, Merranko J, Rosen D. "How psychosocial well-being and usage amount predict inaccuracies in retrospective estimates of digital technology use." Mobile Media & Communication. 2020;8(3):379-399. doi:10.1177/2050157920902830 ↩
- Parry DA, Davidson BI, Sewall CJR, Fisher JT, Mieczkowski H, Quintana DS. "A systematic review and meta-analysis of discrepancies between logged and self-reported digital media use." Nature Human Behaviour. 2021;5(11):1535-1547. doi:10.1038/s41562-021-01117-5 ↩
- U.S. Bureau of Labor Statistics. "American Time Use Survey, 2025 Results." News release USDL-26-1022. June 25, 2026. bls.gov ↩
- U.S. Bureau of Labor Statistics. "Table 11A. Time spent in leisure and sports activities for the civilian population by selected characteristics, averages per day, 2025 annual averages." June 25, 2026. bls.gov ↩
- Pew Research Center. "About half of Americans say they spend too much time on their smartphone." September 1, 2026. pewresearch.org ↩
- Pew Research Center. "What we know about internet use, smartphone ownership and digital divides in the U.S." January 8, 2026. pewresearch.org ↩
- Kemp S. "Digital 2027 Global Overview Report." DataReportal. October 21, 2026. datareportal.com ↩
Written by
Maren AshbyCOO, Unrotten
Maren Ashby is the COO of Unrotten, the iPhone app that helps people take their attention back from the feed. She writes about the research on phones, sleep and focus, and about the small, practical changes that make a phone easier to put down.